
Lightweight tables for R, inspired by gt.
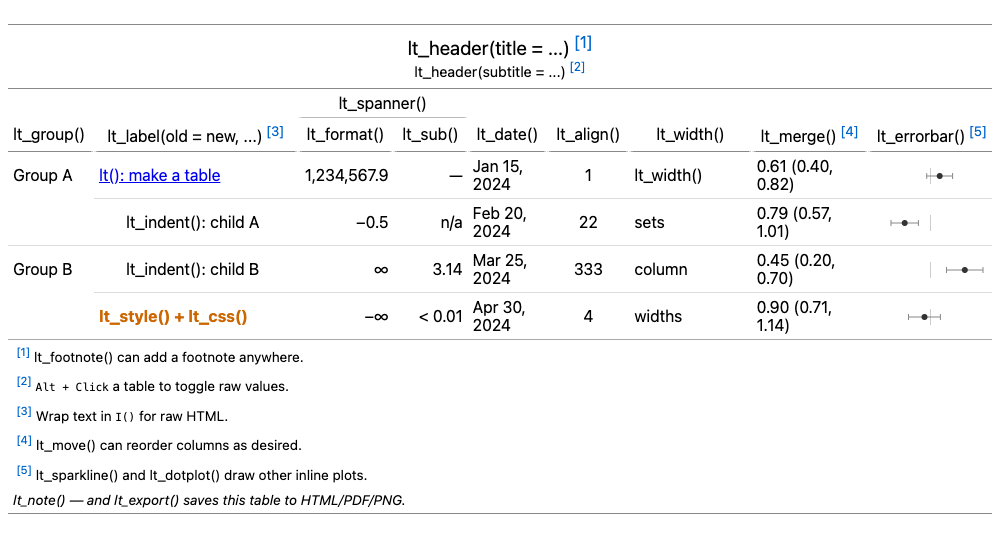
lt provides a small grammar of tables that covers the structure most reports need — titles, column spanners, row groups, footnotes, and number formatting — without the heavy dependency stack. It targets HTML only (no LaTeX or RTF), which keeps the implementation minimal: the entire runtime is a single, tiny vanilla-JS file (see the size badge above).
Tables can also hold inline plots (lt_errorbar(),
lt_sparkline(), lt_dotplot()) and be made
interactive — sorting, searching, per-column filtering, pagination,
resizable columns, column hiding, expandable row detail, and CSV
download — with lt_interactive().
Both inline plots and interactivity live in separate extensions on
top of the core runtime (lt-plot.js and
lt-interactive.js), each loaded only for the tables that
use it. A plain static table pulls in neither, so it stays as light as
ever.
# CRAN version
install.packages("lt")

# development version
install.packages("lt", repos = "https://yihui.r-universe.dev")
You may also play with the package at https://pkg.yihui.org/lt/playground/ without installing it.
lt() creates a table object from a data frame. The
lt_*() functions build on it via the pipe. See https://pkg.yihui.org/lt/examples/01-lt#sec:cheatsheet
for a “cheat table” as an overview of these functions.
Structure
lt_header() — title and optional subtitle above the
table.lt_spanner() — column-spanner label spanning a group of
columns; or auto-infer spanners from column name prefixes.lt_group() — partition rows into labeled groups
(rowspan or full-width separator style), either by column values or
manual row indices.Content & labels
lt_label() — override column header labels.lt_footnote() — attach a numbered footnote to any
region (title, subtitle, column, spanner, group, or body cells).lt_note() — append a plain unnumbered note below the
table.lt_html() — render selected columns’ cells as raw HTML
instead of escaping them. For raw HTML in text (title, labels,
footnotes, …), wrap the text in I() in the corresponding
function.Formatting
lt_format() — numeric formatting: decimal places,
thousand separators, prefix/suffix, percentage, scientific notation,
etc.lt_date() — date/datetime formatting using the browser
locale.lt_sub() — substitute specific values (e.g., replace
0 with "—" or NA with
"n/a").lt_merge() — merge several columns into one using a
sprintf-style pattern.lt_indent() — indent selected rows (useful for
hierarchical row labels).Inline plots
Drawn as SVG in the browser from the numbers alone — nothing but the data travels to the client, and an interactive table draws only the visible rows.
lt_errorbar() — a point estimate with lower/upper
bounds on a scale shared across rows (a forest plot of effect sizes);
several series can stack in one cell, with a colored legend and optional
reference line and axis.lt_sparkline() — a per-row line or bar chart, from a
list-column or several numeric columns read across the row.lt_dotplot() — one dot per column on a shared scale,
optionally colored with a legend and staggered onto separate tracks so
near-equal values do not overlap.By default a plot draws into the first value column’s cells;
lt_errorbar() and lt_dotplot() also take
into= to name a dedicated column to draw into (created when
it does not exist), keeping the value columns visible as text.
Appearance
lt_align() — set column alignment (left / center /
right).lt_width() — set column widths.lt_style() — apply CSS classes or inline styles to
cells, conditionally or unconditionally.lt_css() — attach an external CSS file or URL to the
table.lt_wrap() — set HTML attributes (class,
style, id, …) on the table’s container,
e.g. to scope custom CSS to one table or give it a fixed width.Column order & visibility
lt_move() — reorder columns.lt_hide() — hide columns from the rendered table (still
shipped in the data, so an interactive row detail can surface
them).Interactivity
lt_interactive() — opt a table into client-side
sorting, a search box, per-column filters (text, dropdown, range slider,
or checklist), pagination, resizable columns, column hiding, expandable
row detail (drill-down), and CSV download of the current view. Features
are handled by a small JavaScript extension loaded only for interactive
tables.Export
lt_export() — save a table to a file:
.html (optionally baking a static
<table> that needs no JavaScript to view),
.pdf, or .png (rendered via a headless
Chromium browser).Shiny
lt_output() / render_lt() — Shiny UI and
server bindings.Embedding
lt_spec() — extract a table’s render-ready spec (data
plus ops), to ship to the browser and render client-side with
LT.render().lt_dependency() — the htmlDependency
bundling lt’s runtime assets, for embedding lt tables in other HTML
output (e.g. an htmlwidget).The R code below builds a table spec. Under the hood
lt serializes it to a compact JSON object and ships it
to the browser, where a tiny vanilla-JS runtime renders the
<table>.
library(lt)

d = data.frame(
  Group = c("Treatment", "Treatment", "Control", "Control"),
  Endpoint = c("Primary", "Secondary", "Primary", "Secondary"),
  Estimate = c(0.6123, 0.7891, 0.4567, 0.5432),
  CI_Lower = c(0.4012, 0.5678, 0.2345, 0.3210),
  CI_Upper = c(0.8234, 1.0104, 0.6789, 0.7654),
  P_Value = c(0.0012, NA, 0.1234, NA)
)
lt(d) |>
  lt_group(~ Group) |>
  lt_header("Study Results", "Primary and secondary endpoints") |>
  lt_spanner(`95% CI` ~ CI_Lower + CI_Upper) |>
  lt_format(~ Estimate + CI_Lower + CI_Upper, decimals = 3) |>
  lt_sub(~ P_Value, missing = "n/a") |>
  lt_footnote("Two-sided p-value from log-rank test.", "column", ~ P_Value)
The same table can be built directly in JavaScript. Load
lt.js once on the page, then call LT.build()
from an inline <script> with the JSON spec:
<link rel="stylesheet" href="https://cdn.jsdelivr.net/npm/@xiee/utils/css/lt.min.css">
<script src="https://cdn.jsdelivr.net/npm/@xiee/utils/js/lt.min.js"></script><script>
LT.build({
"data": {
"Group": ["Treatment", "Treatment", "Control", "Control"],
"Endpoint": ["Primary", "Secondary", "Primary", "Secondary"],
"Estimate": [0.6123, 0.7891, 0.4567, 0.5432],
"CI_Lower": [0.4012, 0.5678, 0.2345, 0.3210],
"CI_Upper": [0.8234, 1.0104, 0.6789, 0.7654],
"P_Value": [0.0012, null, 0.1234, null]
},
"ops": [
{ "type": "fmt_number", "columns": ["Estimate", "CI_Lower", "CI_Upper"], "decimals": 3 },
{ "type": "sub", "columns": ["P_Value"], "missing": "n/a" }
],
"row_group": ["Group"],
"header": { "title": "Study Results", "subtitle": "Primary and secondary endpoints" },
"spanners": [{ "label": "95% CI", "columns": ["CI_Lower", "CI_Upper"] }],
"footnotes": [{
"text": "Two-sided p-value from log-rank test.",
"location": { "type": "column_labels", "columns": ["P_Value"] }
}]
});
</script>LT.build() renders the table in place of the calling
<script> tag. One lt.js inclusion
handles any number of tables on the page.
You can find more examples at https://pkg.yihui.org/lt/examples.html. If you are coming from gt, see the migration guide at https://pkg.yihui.org/lt/examples/03-gt.html for a function-by-function mapping and notes on where lt differs.
This package was written with the help of Claude Code. lt is directly inspired by gt by Rich Iannone and the RStudio/Posit team. The grammar of tables that gt pioneered — layering titles, spanners, footnotes, and formatters onto a data frame — is a great idea; lt aims to provide a minimal re-implementation for contexts where a lighter footprint is preferred.